Originally posted on Tuesday, April 16, 2013
The Huffington Post presents, but oddly misconstrues, a shocking fact relating to the growing income inequality in America:
Another day, another mind-blowing fact about the staggering difference between the haves and the have-nots.
Incomes for the bottom 90 percent of Americans only grew by $59 on average between 1966 and 2011 (when you adjust those incomes for inflation), according to an analysis by Pulitzer Prize-winning journalist David Cay Johnston for Tax Analysts. During the same period, the average income for the top 10 percent of Americans rose by $116,071, Johnston found.
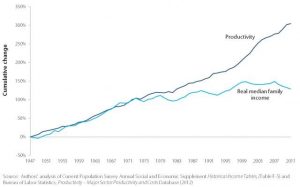
Productivity and Real Median Family Income Growth 1947 – 2009 courtesy of Wikipedia
To put that into perspective: if you say the $59 boost is equivalent to one inch, then the incomes of the top 10 percent of Americans rose by 168 feet, Johnston explained to Alternet last week.
Johnston, a Pulitzer Prize winning tax reporter, in the taxanalysts.com column the HuffPo references, attributes the source of this inequity to tax policy: “Tax policy is driving these trends.” While the presenting problem is very real, Johnston’s diagnosis, as naively reprised in the HuffPo, would appear to be a case of “when all you have is a hammer, everything looks like a nail.” There are not one but two key macroeconomic variables that contribute to a climate of equitable prosperity. Monetary policy must be given at least equal weight to that of tax policy.
As John Aziz, a first rate young economist, notes in his blog:
I have my own pet theory:
The growth in income inequality seems to be largely an outgrowth of giving banks a monopoly over credit creation. In 1971, Richard Nixon severed the link between the dollar and gold, expanding the monopoly on credit creation to a carte blanche to print huge new quantities of dollars and give them to their friends.
Unsurprisingly, this led to a huge growth in the American and global money supplies. This new money was not exactly distributed evenly. A shrinking share has gone to wage labour.
However the dominant explanation on the left is that this is down to the tax structure. I can’t falsify this theory, because the data supports it….
But why has the government chosen to tax corporations less, and payrolls more?
Who owns the government? Political donors — they finance the political system. Before one vote is cast candidates tailor their platforms to meet the criteria of donors. Who are political donors? Well, they are people with spare capital to expend in the name of getting politicians elected.
So who are the biggest donors? Banks & large corporations: the very people who have benefited most from the post-1971 tidal wave of fiat credit creation.
So not only has an exorbitantly high proportion of new credit gone into corporate and financial profits, but the beneficiaries have used these fruits to buy out the political system, thus ensuring that they keep an even higher proportion of their incomes, while making up for this slump with greater borrowing, and greater taxation of payrolls.
Aziz notes that the left’s hypothesis as to the role of the tax structure in fomenting income inequality is not falsified by the data. Yet it is passing strange that the obvious privileges in credit allocation observed under the fiduciary dollar standard should escape the left’s critique.
This strangeness is compounded by the fact that even Marx himself observed that “money is by nature gold” and Fabian Socialist George Bernard Shaw’s observation in The Intelligent Women’s Guide to Socialism and Capitalism that “You have to choose between trusting to the natural stability of gold and the natural stability of the honesty and intelligence of the members of the government. And, with due respect to these gentlemen, I advise you, as long as the capitalist system lasts, to vote for gold.”
Recent Comments